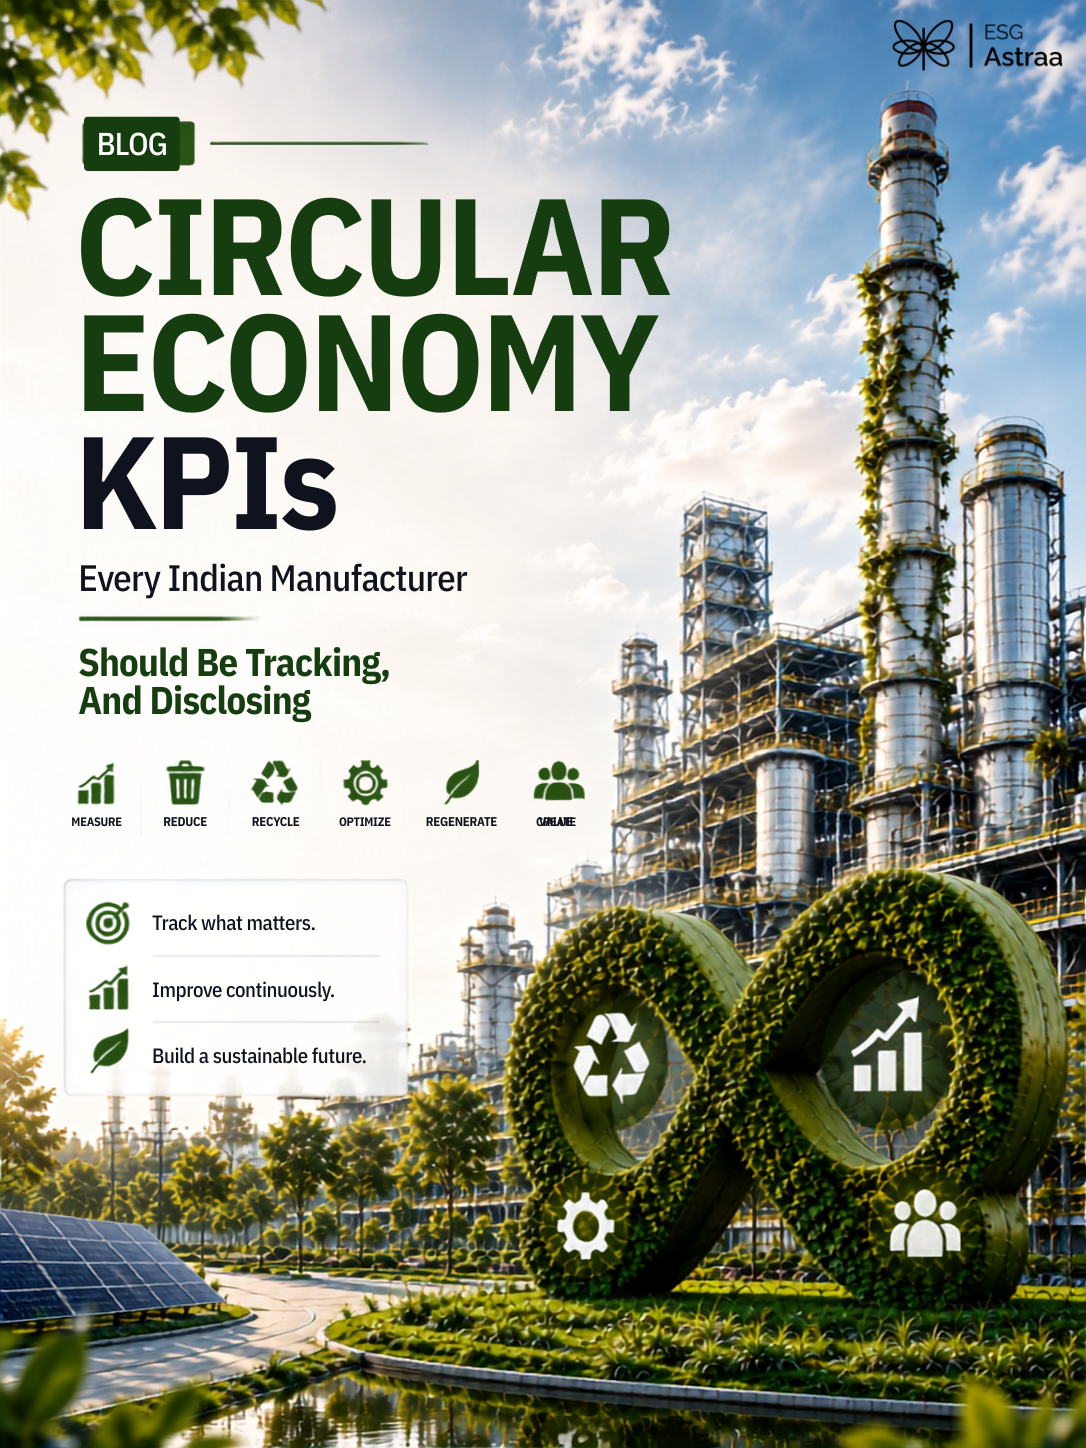
Circular Economy KPIs Every Indian Manufacturer Should Be Tracking, And Disclosing
A practical breakdown of the material, water, and end-of-life metrics that make circularity claims disclosure-ready.
Reading Time
5 min
Article Sections
6
Share Links
3
On This Page
Article Section
Introduction
A manufacturer can report "zero waste to landfill" and still have no real visibility into how much of its input material is virgin versus recycled, or how efficiently it is actually closing material loops.
As BRSR disclosure expectations and stakeholder scrutiny around resource use intensify, generic circularity claims are giving way to specific, trackable KPIs that regulators, lenders, and customers increasingly expect to see.
This article breaks down the core circular economy KPIs Indian manufacturers should be tracking, and explains what makes each one disclosure-ready.
Article Section
What Circular Economy KPIs Actually Measure
Circular economy KPIs measure how materials, water, and energy move through a manufacturing process, from the moment raw inputs enter a plant to what happens to a product once it reaches the end of its life. Unlike a single waste disposal figure, these indicators show whether a company is genuinely closing loops or simply managing outputs more efficiently.
These metrics matter now for reasons beyond compliance. Rising input costs and resource security concerns are pushing manufacturers to treat circularity as an operational discipline, not just a reporting requirement, since every tonne of virgin material avoided is also a cost saved. At the same time, BRSR's expanding expectations around resource use are making vague circularity claims increasingly difficult to sustain without underlying data.
Most circular economy KPIs fall into three broad categories: material flow indicators that track what goes into and comes out of production, water and energy circularity indicators that measure closed-loop efficiency within operations, and end-of-life indicators that capture what happens to a product and its packaging after it leaves the company's control.
Article Section
The Core KPIs to Track
Material Flow KPIs
Recycled input rate measures the share of total material inputs sourced from recycled or reclaimed sources rather than virgin extraction, typically tracked as a percentage of total material mass. Virgin material dependency is the inverse view of the same data, useful for setting reduction targets over time. Material intensity per unit of output, calculated as total material consumed divided by units produced, shows whether a company is becoming more efficient with the material it uses, independent of production volume changes.
Water Circularity KPIs
Water reuse and recycling rate tracks the proportion of total water demand met through recycled or treated water rather than fresh withdrawal, and is one of the more visible circularity indicators to stakeholders. Freshwater withdrawal intensity, measured per unit of production, shows whether water efficiency is improving independent of output volume. Closed-loop process water share captures how much of a facility's process water is captured and reused within the same operation rather than discharged and replaced.
Energy and Waste KPIs
Waste diverted from landfill measures the percentage of total waste generated that is recycled, reused, or otherwise processed instead of landfilled, and is often the most commonly disclosed circularity metric, though it says little on its own about material quality. Hazardous waste intensity, tracked per unit of production, is material for most manufacturing sectors and increasingly scrutinized in BRSR filings. Energy recovered from waste processes, where applicable, captures value extracted from waste streams rather than treating them purely as a cost.
End-of-Life and Product Recovery KPIs
Product take-back rate measures the share of sold products a company recovers at end of life through formal collection programs, relevant particularly for electronics, batteries, and packaging-intensive sectors. Packaging recyclability tracks the percentage of packaging material that is technically recyclable within existing infrastructure, not just theoretically recyclable. Extended producer responsibility fulfillment metrics track a company's performance against its regulatory EPR obligations, an increasingly disclosed figure given India's EPR rules for plastics and e-waste.
Article Section
Making These KPIs Trackable and Disclosure-Ready
How to Start Tracking These KPIs?
Begin by establishing baseline measurement at the plant level before attempting group-level consolidation, since circularity performance varies significantly across sites and averaging too early can obscure where the real gaps are.
Common Disclosure Mistakes
The most common error is reporting a circularity claim without a defined calculation methodology behind it, followed closely by inconsistent units or boundaries across plants that make consolidated figures misleading. A third common mistake is conflating waste reduction with genuine circularity, since reducing waste volume is not the same as closing a material loop.
Making KPIs Disclosure-Ready
Before publishing any circularity KPI, document the data source, the calculation methodology, and the reporting boundary behind it, and apply the same definitions consistently across every site. Aligning terminology with BRSR and recognized frameworks such as GRI makes the figures easier for assurance providers and stakeholders to verify.
Article Section
Conclusion
Circular economy performance becomes credible only when it is broken into specific, trackable KPIs across material, water, and end-of-life categories, rather than summarized as a single sustainability claim.
Manufacturers that build consistent tracking now will find disclosure far less disruptive as reporting expectations continue to tighten.
Article Section
Frequently Asked Questions
What are circular economy KPIs?
Circular economy KPIs are specific metrics that track how materials, water, and energy move through a manufacturing process, from raw input to end-of-life outcome, rather than a single waste disposal figure.
Which circular economy KPIs matter most for Indian manufacturers?
Recycled input rate, water reuse rate, waste diverted from landfill, and product take-back rate are among the most commonly tracked and disclosed KPIs for Indian manufacturers.
How is recycled input rate calculated?
Recycled input rate is calculated as the share of total material inputs, by mass, sourced from recycled or reclaimed materials rather than virgin extraction.
Why do circular economy KPIs matter for BRSR disclosure?
BRSR's expanding expectations around resource use make vague circularity claims difficult to sustain without specific, well-documented underlying data.
What is the difference between waste reduction and true circularity?
Waste reduction lowers the volume of waste generated, while true circularity means materials are captured and reused in a closed loop rather than simply generated less.
Keep Reading
Related Blogs
All Industries
ESG and the Indian SME
Why Small Suppliers Are Suddenly Under Pressure From Their Largest Clients
Read more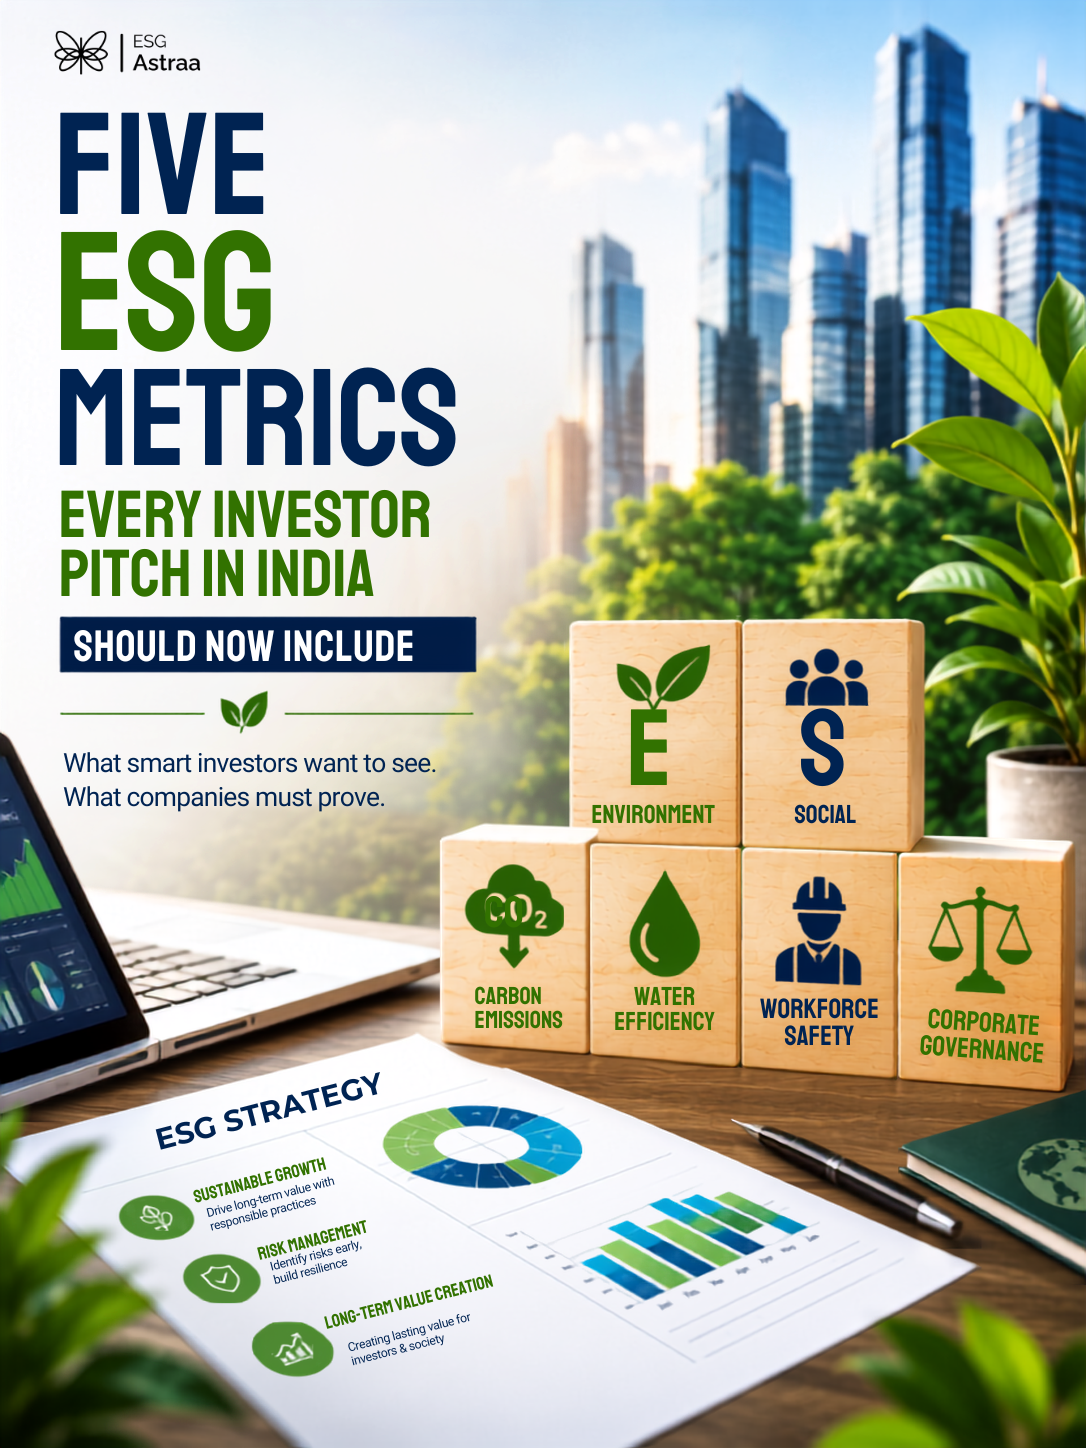
All Industries
Five ESG Metrics Every Investor Pitch in India Should Now Include
Most Still Don't Know
Read more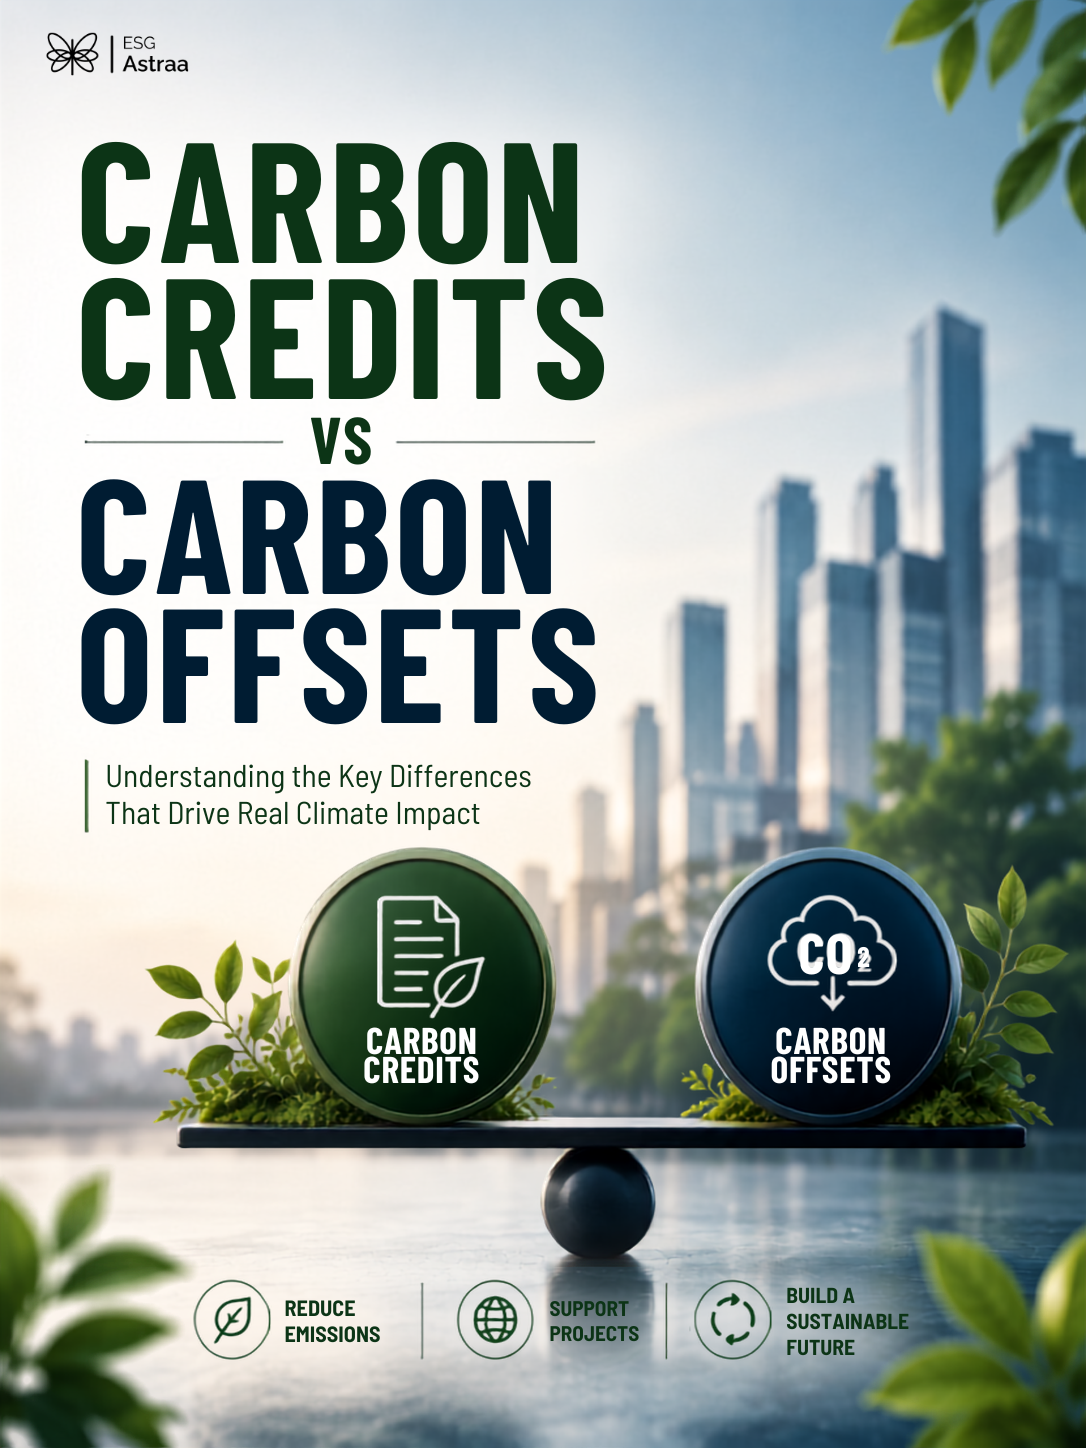
All Industries
Carbon Credits vs Carbon Offsets
Understanding the Difference Before Making Climate Claims
Read moreNext Step
Ready to turn ESG complexity into strategic advantage?
Talk to ESG Astraa about disclosures, climate strategy, governance controls, and execution support for your team.